Forex Forum

Would you like to react to this message? Create an account in a few clicks or log in to continue.
Forex Forum

Forex Forum, Discussion all about Forex, Forex Trading, Forex Software, Forex Indicator, Forex News and Forex Brokers


    Daily Market Analysis by ForexMart

    avatar
    AppleFXMart


    Posts : 1014
    Join date : 2016-10-09

    Daily Market Analysis by ForexMart Empty Daily Market Analysis by ForexMart

    Post  AppleFXMart Sun Oct 09, 2016 10:56 pm

    USD/JPY Fundamental Analysis: October 10, 2016

    The JPY went higher in relation to the USD after a long losing streak in nine trading sessions after the release of a somewhat negative US Non-Farm Payrolls report disappointed investors and traders. The USD/JPY pair traded at 102.906, decreasing by -1.00% or 1.042 points.

    The US Non-Farm Payrolls report came out at 156,000, way below the expected 177,000 prediction for the NFP in September. Unemployment rates also increased by 5.0% from the previous data release of 4.9%. However, the data for the Average Hourly Earnings increased from 0.1% to 0.2%, with limited trader reactions since the data met its previous expectations.

    Investors are now speculating that the disappointment in the US payrolls report makes it impossible for a Fed rate hike in November, but is still strong enough for an interest rate hike in December. Market buyers were also compelled to book their profits due to a slight drop in US Treasury Futures data.

    The decrease in the USD/JPY came as a surprise to some investors since the economic data release, although on the negative side, is still strong enough to maintain speculations for an interest rate hike before 2016 ends. The pair is seen to further weaken since Monday is a bank holiday, and the absence of major market players could cause the pair to lose some of its current trading value.

    Daily Market Analysis by ForexMart 14611035_198545170571651_8436740596423667919_n
    avatar
    AppleFXMart


    Posts : 1014
    Join date : 2016-10-09

    Daily Market Analysis by ForexMart Empty Re: Daily Market Analysis by ForexMart

    Post  AppleFXMart Sun Oct 09, 2016 11:15 pm

    NZD/USD Technical Analysis: October 10, 2016

    The NZD/USD pair had unchanged rates during the last session at 0.7168 points with a possibility of daily lows at 0.7149 points. The NZD/USD is expected to slow down in spite of a diminishing trade activity surrounding the USD, and the negative impact of lowered oil prices to the NZD.

    The financial market in general has also moved towards the sidelines as different market players are now closely monitoring the second US presidential debate. The US market holiday is also expected to further cause stagnation in this particular currency pair.

    Investors are now awaiting a series of statements to be released by the Federal Reserve, as well as Chinese trading data and CPI data which are all due within this week. These data are all expected to have an impact on the NZD/USD pair.
    .0
    The resistance levels for the NZD/USD is currently at 0.7207 at the 100-DMA, with a significant possibility of a gain extension at 0.7521 at the 20-DMA. From there, the pair could possibly extend its range at 0.7275 at the 50-DMA. On the other hand, the pair’s current support levels is located at its two-month low of 0.7110, with a possibility of lowering at 0.7084 and 0.7064 points.

    Daily Market Analysis by ForexMart 14590442_198552450570923_7677588596867539572_n
    avatar
    AppleFXMart


    Posts : 1014
    Join date : 2016-10-09

    Daily Market Analysis by ForexMart Empty Re: Daily Market Analysis by ForexMart

    Post  AppleFXMart Sun Oct 09, 2016 11:45 pm

    GBP/USD Technical Analysis: October 10, 2016

    The GBP/USD pair saw little activity during the last trading session and consolidated at 1.2430 points following last week’s sudden crash has caused markets to speculate whether the sterling pound has based here or otherwise.

    The GBP/USD decreased from 1.2614 points to lows at 14 cents lower while the GBP has incurred increased volatility after the hard Brexit announcement from UK Prime Minister Theresa May. However, the sterling pound’s value might become useful for the Bank of England.

    For the pair’s technical indicators, the GBP/USD’s resistance is at 1.2397, only a few points shy of its high of 1.3056, with considerations that the market will be directly offered below. Meanwhile, analysts are saying that the currency pair’s technical bearings have lost some of its accuracy due to the pound’s recent sharp decline, but the risk is projected to remain at the downside despite the negativity surrounding the sterling pound.

    The pair’s technical indicators maintained their bearish stance, with RSI indicators headed towards 19 points. On the other hand, selling interest levels are placed at 1.2500, with a possible recovery of the pair going up the 1.2620 trading range.

    Daily Market Analysis by ForexMart 14650677_198570847235750_1509984593902627549_n
    avatar
    AppleFXMart


    Posts : 1014
    Join date : 2016-10-09

    Daily Market Analysis by ForexMart Empty Re: Daily Market Analysis by ForexMart

    Post  AppleFXMart Mon Oct 10, 2016 1:14 am

    AUD/USD Technical Analysis: October 10, 2016

    The U.S. labor market is on a low these past weeks which is favorable for the AUD/USD pair as it helps to its recovery from two-week lows. The price activity remains Bearish with a formidable support at 0.7550 after a 4 day decline. The Consolidation range is between 0.7550 and 0.7590.

    Its 50, 100 and 200 EMAs are moving in downtrend with 200 EMAs came to a halt after it tried to break higher. The MACD implies the seller's’ position to weaken as it continue to grow while its RSI is within the bounds of oversold area.

    Such trend continues and breaks at 0.7600 will further extend its recovery to 0.7650. The next target for the sellers stay at 0.7540 support level.

    Daily Market Analysis by ForexMart 14591609_198603640565804_5592344578650390695_n
    avatar
    AppleFXMart


    Posts : 1014
    Join date : 2016-10-09

    Daily Market Analysis by ForexMart Empty Re: Daily Market Analysis by ForexMart

    Post  AppleFXMart Mon Oct 10, 2016 1:49 am

    GBP/USD Fundamental Analysis: October 10, 2016

    The outset of the pair fluctuated under the pressured area due to the remarks made by UK PM May that also laid out the itinerary of the EU exit process and made some indication regarding a tough negotiations and process.

    The sterling and greenbacks sustained a weak position and drove to the lowest level of Brexit at 1.2790 wherein the market was very apprehensive during that time. Furthermore, a tension were formed as the GBPUSD dropped 800 pips within 5 minutes over the trading hours. Nobody knows the main reason that proceeded for a declivity accompanied with major losses accrued by bullish investors.

    After the damage that occurred, the pound and dollar were able to compensate its deficit on Friday but the level of uncertainty or risk that the pair demonstrated indicated that it does not hold a stable conditions at present. It is recommended for the traders to wait more at least for two day so that it is much secured in dealing with this two currencies. The support is nearby the 1.2200 and resistance is spotted at 1.2500. Be more cautious in trading using pound and greens, it is much advisable to set aside this first.

    Daily Market Analysis by ForexMart 14606269_198605883898913_8705381269799102186_n
    avatar
    AppleFXMart


    Posts : 1014
    Join date : 2016-10-09

    Daily Market Analysis by ForexMart Empty Re: Daily Market Analysis by ForexMart

    Post  AppleFXMart Mon Oct 10, 2016 2:11 am

    USD/CAD Fundamental Analysis: October 10, 2016

    During the entire week the USD CAD remained in the support level of 1.3080 while the resistance settled at 1.3280. The pair reached the endpoint at an extreme range finished over the 1.3296 region and it is assumed that the pair seems a bullish run but the outset still unidentified.

    Aside from the FOMC meeting on US, major news are awaited by the Canadian region. It is important to note that there is an upcoming break at the top of the range plunged at 1.3280. Moreover, we are looking forward for a clear break of resistance on Monday though still needs some ratification, and if it take place then it would likely indicate a pair retesting by which traders and investors should be ready about. While waiting for the rapid price decline, it has greater chance to have more period of consolidation over the given range which may carried throughout a few more days.

    Daily Market Analysis by ForexMart 14611069_198616497231185_4877935112471853152_n
    avatar
    AppleFXMart


    Posts : 1014
    Join date : 2016-10-09

    Daily Market Analysis by ForexMart Empty Re: Daily Market Analysis by ForexMart

    Post  AppleFXMart Mon Oct 10, 2016 3:13 am

    USD/CAD Technical Analysis: OCtober 10, 2016

    The pair USD/CAD leaped to 150 points and closed at 1.3283 last week. The Canadian labor market advanced last August that rendered 67.2 thousand jobs. However its losses overshadowed the advantages with disappointments from the NFP results since wage growth and short of jobs in the data.

    The pair started the week at 1.3130 followed by a low in 1.3067 level. It bounced to high of 1.3313 and continues to move upward with the Resistance sustained at 1.3353. It closed at 1.3283 level.

    Overall, the trend remains Bullish despite growth in oil prices and strong job report. The December rate hike is still pending with USD advances in a positive outlook.

    Daily Market Analysis by ForexMart 14563439_198622497230585_3718692519948561312_n
    avatar
    AppleFXMart


    Posts : 1014
    Join date : 2016-10-09

    Daily Market Analysis by ForexMart Empty Re: Daily Market Analysis by ForexMart

    Post  AppleFXMart Mon Oct 10, 2016 11:04 pm

    GBP/USD Technical Analysis: October 11, 2016

    The GBP/USD pair dropped from its peak of 1.2440 points and has now recorded a new low during the New York trading session. The pair is now trading within the 1.2360 range and its slight recovery during the earlier part of the London session caused the GBP/USD to retain its downward direction in the middle of little market volatility.

    The direction of the currency pair was driven by the movement of the USD due to lack of any relevant economic data released during the last trading session. The USD movement has recently been benefitting from an ease in risk aversion following the results of the US Presidential Debate. On the other hand, the sterling pound is experiencing downward pressures due to post-Brexit uncertainties, causing the GBP to decrease further during the last trading session.

    The 4-hour chart for the currency pair shows that the GBP/USD is starting to bounce back from Friday’s sudden decline even though technical indicators are still a long way from fully recovering. The 20-SMA has also decreased further and is now at 1.2560. The pair reached 1.2476 points, its highest point reached after its most recent decline. The GBP/USD must go beyond this range and reach up to 1.2520 and 1.2600 in case the USD succumbs to selling pressure.

    Daily Market Analysis by ForexMart 14702271_199102903849211_6594714142478252318_n
    avatar
    AppleFXMart


    Posts : 1014
    Join date : 2016-10-09

    Daily Market Analysis by ForexMart Empty Re: Daily Market Analysis by ForexMart

    Post  AppleFXMart Tue Oct 11, 2016 1:24 am

    AUD/USD Technical Analysis: October 11, 2016

    The AUD/USD pair’s 50-MA level for the recent trading session reached the 0.7608 trading range, with trades now at 0.7590 in spite of the widening of the 10-year yield spread for AU-US. High yielders further reaped benefits during the second quarter of yields in the international market. The 10-year yields for Australia increased by 7 bps while the 10-year US yields increased by 3 bps.

    Analysts are stating these higher yields could have negative impacts on all aspects of the risk spectrum since this could lead to a drop in high-yielding currencies such as the NZD.

    Should the AUD/USD recover, then the bid tone recovery could go up into the resistance level of 0.7608 for the 50-DMA and could possibly go further up to 0.7626 for the 10-DMA. However, if the previous support levels of 0.7580 would be reached by the pair, then this could lead to a possible drop to 0.7553, with sell-offs further extending to 0.7526 which is the 100-DMA level for the GBP/USD pair.Daily Market Analysis by ForexMart 14650339_199103940515774_4534320988198188407_n
    avatar
    AppleFXMart


    Posts : 1014
    Join date : 2016-10-09

    Daily Market Analysis by ForexMart Empty Re: Daily Market Analysis by ForexMart

    Post  AppleFXMart Tue Oct 11, 2016 1:58 am

    NZD/USD Technical Analysis: October 11, 2016

    The NZD/USD weakened during the last trading session after the USD regained some of its lost value, with the demand now testing within the 0.71 range. The USD remained sturdy throughout the Asian trading session due to the US treasury yields increase caused by rising oil prices. This also heightened the possibility of an interest rate hike this coming December, along with an exhaustion on the part of central banks and a deepening of the yield curve on the international market.

    The currency pair is now dependent on the market sentiment, particularly now that the Reserve Bank of New Zealand’s Assistant Governor is set to deliver a statement with regards to the country’s low inflation rates.

    Since the NZD/USD is already trading lower than the 50-DMA and 100-DMA levels, an acceptance rate lower than 0.71 might have a significant impact on the bulls. Should the currency pair break through the support levels of 0.7049, then this could possibly reveal the 0.70 handle. On the other hand, an increase from Friday’s low of 0.7110 might lead to a steeper retracement level to 0.7155 for the 100-DMA and 0.7204 for the 10-DMA.

    Daily Market Analysis by ForexMart 14519905_199103977182437_1919349172186272417_n
    avatar
    AppleFXMart


    Posts : 1014
    Join date : 2016-10-09

    Daily Market Analysis by ForexMart Empty Re: Daily Market Analysis by ForexMart

    Post  AppleFXMart Tue Oct 11, 2016 2:12 am

    4 EUR/USD Technical Analysis: October 11, 2016

    The markets of Canada, Japan and United States were consolidated. The greenbacks have improved their position right after Hillary Clinton obtained the victory on the second Presidential debate against Donald Trump because Trump’s respective image were castigated after the news broke regarding his negative treatment over a particular women as seen in the leaked video.


    Once again the single euro currency hit the pressured zone. After the pair reach the 1.1200 region there is a sudden turning point and promptly descended to the 1.1150 level. As of the moment, the euro and greens are currently moving in downward slope and arriving to a much lower price direction. Moving averages 50, 100 and 200 strived to keep the 1.1200 level. There is a toggling in prices since its prices were switching to an upper and lower movements as featured in the 4-hour chart. Resistance laid over in the 1.1200 level, support possessed the region 1.150. MACD histogram had tailed off which means that the seller’s strength became more effective. RSI draw near the negative positions.

    Daily Market Analysis by ForexMart 14690894_199150090511159_4067668245957864137_n
    avatar
    AppleFXMart


    Posts : 1014
    Join date : 2016-10-09

    Daily Market Analysis by ForexMart Empty Re: Daily Market Analysis by ForexMart

    Post  AppleFXMart Tue Oct 11, 2016 2:28 am

    USD/CAD Fundamental Analysis: October 11,2016

    The greenbacks and loonies unexpectedly maneuver to a different direction. The USD completely outperform other instruments including the CAD which also lose its stability. Therefore, the pair suffered from a downfall from its weekly highs and plunged in the 1.3250 and the support befall at 1.3180.

    Regardless of a positive report of the employment in Canada last Friday, the fall off still occurred due to the notice made by Iraq about the oil price hike and limited petroleum production. However, it is much of undisputed origin that this recession is caused by the consolidation period in line with the outset of an uptrend. According to previous forecasts, there will be an indecision phase for the pair and executed a clean break through within the 1.3280 and at 1.2800 low hence signalling another direction of the trend. The pair currently covers the region 1.3198 and the trend pause is predicted to resume further.

    No new major reports were made from either countries, US or Canada that’s why this trading levels remains together with the upsurge of the prices in crude oil. This event had maintained its support for a medium and long term opportunities.

    Daily Market Analysis by ForexMart 14601056_199152110510957_8140720438253840957_n
    avatar
    AppleFXMart


    Posts : 1014
    Join date : 2016-10-09

    Daily Market Analysis by ForexMart Empty Re: Daily Market Analysis by ForexMart

    Post  AppleFXMart Tue Oct 11, 2016 2:39 am

    6 USD/JPY Fundamental Analysis: October 11,2016

    The Fed is planning to have a cost increase this year which cause the greenbacks to establish a much stronger condition. The pair generated a bullish trend and pose a buy mode yesterday. There is a negative notion and jumped to the 102.90 region then proceeded to a more advanced status. The USDJPY retrieve its entire losses during the EU sessions.

    The price channel is in the middle period showing an upward movement as manifested in the 4-hour chart. The moving averages seems bullish while the 50-EMA had drawn out its limit as shown in the same time horizons.
    MACD initiated an opposite direction seen in the hourly chart. The histogram firmly developed and signaled for the strength of the buyers. RSI approached the overvalued area.

    Daily Market Analysis by ForexMart 14590454_199152343844267_431141120274261205_n
    avatar
    AppleFXMart


    Posts : 1014
    Join date : 2016-10-09

    Daily Market Analysis by ForexMart Empty Re: Daily Market Analysis by ForexMart

    Post  AppleFXMart Tue Oct 11, 2016 3:11 am

    7 USD/CAD Technical Analysis: October 11, 2016

    A short topping pattern was formed as the support from 1.3160 has been breached to 1.3312 with the 1.2460 level as the Consolidation pattern. It is expected for a retracement from 1.4689 then 1.2460 to 1.3311 Resistance zone. The intraday bias is going downward to 1.2999 support level.

    A reversal is expected once there is a break that is target near the 1.2763 support level. If the break has been prolonged at 1.3311, this will cause it to bounce to 1.2640 with the target of 1.3838 at Fibonacci level.

    The medium topping pattern seen at 1.4689 signals a Correction pattern. This could go lower and further decline will become a retracement for 50% at 0.9406 to 1.4689 up to 1.2048 level. This is close to 1.1919 medium term support. A strong support level would cause the trend to regain. However, if a break holds at 38.2%, there will be a retracement of 1.4689 to 1.2460 at 1.3311 make way for a reversal. The next target will be at 1.3838 with 61.8% retracement.

    Daily Market Analysis by ForexMart 14610998_199170557175779_5275253555136728970_n
    avatar
    AppleFXMart


    Posts : 1014
    Join date : 2016-10-09

    Daily Market Analysis by ForexMart Empty Re: Daily Market Analysis by ForexMart

    Post  AppleFXMart Tue Oct 11, 2016 3:24 am

    8 USD/CHF Technical Analysis: October 11, 2016

    The USD increase by 0.24% against CHF and closed at 0.9802 for the past 24 hours,

    Swiss Unemployment rate is known to be periodic but the September data sustained at 3.3% while the market expected it to rise at 3.4% instead.
    The pair USD/CHF is being traded at 0.9833 in the Asian session at GMT 0300. The USD is elevated by 0.32% against CHF more than the price closed yesterday.

    The target support is at 0.9791 down to 0.9749 level. The resistance is at 0.9858 and could go higher to 0.9883 level. The pair’s trading activity has move beyond 20 Hr and 50Hr Moving Averages.

    Daily Market Analysis by ForexMart 14601099_199170727175762_5112734954443131131_n
    avatar
    AppleFXMart


    Posts : 1014
    Join date : 2016-10-09

    Daily Market Analysis by ForexMart Empty Re: Daily Market Analysis by ForexMart

    Post  AppleFXMart Tue Oct 11, 2016 3:39 am

    EUR/JPY Technical Analysis: October 11, 2016

    The price activity for today stays at neutral state. Once a break of 116.36 would bounce to 109.20 with a target at 100% prediction of 109.20 to 118.45 starting at 112.07 to 121.32 levels. There is a possibility of topping near the 121.36 at Fibonacci level. However, if it fell below the 114.35 minor support, it will go back to its neutral state.

    The medium term bottom is at 109.20 level and this could extend once rebounded but reversal is not as strong for now. However, if it rallied a strong resistance after a 38.2% retracement of 141.04 to 109.20 at 121.36 to hold in check the trend on the first try. A break of 112.07 will continue the downward direction from 149.76 from a 76.4% retracement of 94.11 to 149.76 at 107.24.

    Daily Market Analysis by ForexMart 14650153_199188393840662_915232602895458705_n
    avatar
    AppleFXMart


    Posts : 1014
    Join date : 2016-10-09

    Daily Market Analysis by ForexMart Empty Re: Daily Market Analysis by ForexMart

    Post  AppleFXMart Tue Oct 11, 2016 10:15 pm

    1 NZD/USD Fundamental Analysis: October 12, 2016

    The NZDUSD pair produced six more points subsequent to the releasing of data in the morning of the trading session. The NZD made a breakthrough seeing that the retail sales of Ecards outstrip its total sales for the previous months. The Fed policymakers made a proposal regarding the repression of the interest hike.Thereupon, the kiwi escalated approaching to its highest level.

    Although the FOMC board of governors consider the US economic status is in good condition to grant a rate increase, they still come to a decision of suspending first the upsurge because the evaluation of the remaining determinants and evidences continues.

    Daily Market Analysis by ForexMart CuihbQiWIAAE0UG
    avatar
    AppleFXMart


    Posts : 1014
    Join date : 2016-10-09

    Daily Market Analysis by ForexMart Empty Re: Daily Market Analysis by ForexMart

    Post  AppleFXMart Tue Oct 11, 2016 10:46 pm

    2 USD/CAD Technical Analysis: October 12, 2016

    Undeterred by the softening of the petroleum prices, the loonies and greenbacks persist on opening over a higher position. The market sentiment revealed a positive tone since Tuesday. The USD/CAD expanded its timeframe for a short-term upward trajectory after its recovery from the steep decline that took place last Monday.

    The dollar plunged into the 100-EMA as its alternative support price as shown in the 4-hour chart. While the pair directed an ascending position, it made a breakthrough in the 50-EMA and took a separate route apart from the moving averages within the same chart. Moreover, the said indicators preserve a bullish trend. Resistance stand at 1.3300 region while support keep going with the 1.3200 level.

    MACD manifested a moment of depreciation and reduce the buyer’s strength. RSI secured a neutral position. It is speculated that the pair would reach 1.3300 level of resistance for the next day.

    Daily Market Analysis by ForexMart 14680771_199619717130863_6516570341321940658_n
    avatar
    AppleFXMart


    Posts : 1014
    Join date : 2016-10-09

    Daily Market Analysis by ForexMart Empty Re: Daily Market Analysis by ForexMart

    Post  AppleFXMart Tue Oct 11, 2016 10:55 pm

    3 GBP/USD Technical Analysis: October 12, 2016

    Concerns regarding hard-Brexit last Tuesday made the pound to stay behind the pressured area. The tone of the market against GBP established negative sentiment yesterday. The pair also experienced a downswing for two consecutive days. The price progresses from 1.2200 to 1.2300 regions.

    The conjecture loss of the sterling is 0.66% upon the ongoing negotiations. The 50, 100 and 200 EMAs extended its recession period. Resistance were able to get the 1.2400 level, support entered the 1.2300 region.

    MACD stick around same level as of yesterday which bolsters the seller’s strength. The RSI oscillator indicator is seen in the negative area. The pair is assumed to work in the downtrend position when it reach the lower level of 1.2300

    Daily Market Analysis by ForexMart 14656446_199622080463960_7337760644284509806_n
    avatar
    AppleFXMart


    Posts : 1014
    Join date : 2016-10-09

    Daily Market Analysis by ForexMart Empty Re: Daily Market Analysis by ForexMart

    Post  AppleFXMart Wed Oct 12, 2016 12:11 am

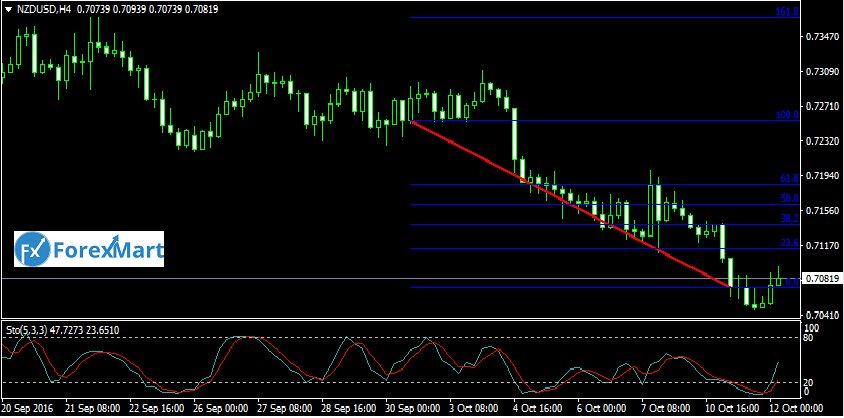
    NZD/USD Technical Analysis: October 12, 2016

    The pair geared its focus to the January to May trendline after a break at .7204 with 8/29 low. It declined to .7020 level and continues downtrend would risk its 200-EMA and low at .6951 which is close to the target head and shoulder of short term course. A strong resistance at .7204 put an end to a Bearish trend.

    Daily Market Analysis by ForexMart 14670608_199646130461555_4257017193008534160_n
    avatar
    AppleFXMart


    Posts : 1014
    Join date : 2016-10-09

    Daily Market Analysis by ForexMart Empty Re: Daily Market Analysis by ForexMart

    Post  AppleFXMart Wed Oct 12, 2016 12:23 am

    AUD/USD Technical Analysis: October 12, 2016

    The pair AUD/USD is on a risk of breakout after the support close to .7380 bounced back to its major resistance. This was higher than the October and December highs last 2015 as well as the 200 EMA. If the price stayed at .7442 to sustain the positive short-term outlook. Support with Retracement levels are at .7544 and .7575 which was reached yesterday.

    Daily Market Analysis by ForexMart 14633039_199646213794880_2953373767574094370_n
    avatar
    AppleFXMart


    Posts : 1014
    Join date : 2016-10-09

    Daily Market Analysis by ForexMart Empty Re: Daily Market Analysis by ForexMart

    Post  AppleFXMart Wed Oct 12, 2016 1:05 am

    USD/JPY Technical Analysis: October 12, 2016

    The price activity yesterday was strongly going upwards. The 50, 100 and 200 EMAs move uptrend. It continues to strives to breach the resistance level at 104.00 to 104.30. The support level holds at 103.50.

    The MACD is in the positive zone while the histogram declined. This implies the weakening of buyers pushing RSI oscillator to upper bounds.

    The supply outbalances the demand that puts pressure to buyers. Hence, there is a possibility for a price reversal to 103.00 level as the market lacks motivation. If it stays at 104.00 level, it is most likely for the prices to move down. On the other hand, the dollar gets stronger because of the awaited Fed rate hike.

    Daily Market Analysis by ForexMart 14702384_199646250461543_6676317253765909625_n
    avatar
    AppleFXMart


    Posts : 1014
    Join date : 2016-10-09

    Daily Market Analysis by ForexMart Empty Re: Daily Market Analysis by ForexMart

    Post  AppleFXMart Wed Oct 12, 2016 2:03 am

    USD/JPY Fundamental Analysis: October 12, 2016

    The USD/JPY pair closed the last trading session at 103.516 points during the last trading session, dropping by -0.08% or 0.085 after investors flocked to the safe haven currency due to a break in crude oil and stock prices, wiping out the currency pair’s gains during the earlier part of the trading session.

    The USD was backed by support from statements that the 10-year yields for the US were at its highest levels in over four months. Due to positive interest rate differentials, the dollar consistently appreciated against the JPY during the past eleven trading sessions, however, the carry trade exhibit last Tuesday proved to be crucial for the US dollar.

    Analysts are saying that this particular scenario might be could possibly occur again on Wednesday’s trading session due to the impending release of the Federal Reserve’s meeting minutes. These minutes will be of use to market players in order for them to gauge the overall sentiment of Fed officials with regards to the expected interest rate hike in December.

    Although the meeting minutes from the Fed usually only cause little volatility in the market, analysts are saying that this particular report might become an exception, especially since the USD/JPY is expected to have a reaction to Treasury yields movement and might reflect its price action in the previous trading session.

    Daily Market Analysis by ForexMart 14716051_199672007125634_789593485357082889_n
    avatar
    AppleFXMart


    Posts : 1014
    Join date : 2016-10-09

    Daily Market Analysis by ForexMart Empty Re: Daily Market Analysis by ForexMart

    Post  AppleFXMart Wed Oct 12, 2016 2:15 am

    EUR/JPY Technical Analysis: October 12, 2016

    The EUR/JPY pair was able to retain its support on the 50-DMA and expected to incur additional losses in the light of an expected increase in the USD/JPY pair. The cross-currency pair is now at 114.40 points, going above the 38.2% Fibonacci retracement of 114.09 points. The EUR/JPY dropped yesterday to 114.01 points after constant rejection in the 100-DMA in the past week.

    All eyes are on Bank of Japan as BoJ Governor Kuroda is slated to make a speech today. Meanwhile, European industrial production data is also expected to be released today. But the major announcement for today will be likely coming from the Federal Reserve’s Esther George and William Dudley, who is expected to announce that there is a huge possibility for an interest rate hike in December.

    For the cross-currency pair’s technical indicators, the pair’s break through at 114.09 could possibly lead to a low of 112.79, which could then lead to a leveling of 112.00. On the other hand, an increase over the 10-DMA of 144.76 could cause another break at the 5-DMA of 115.05, which could ultimately lead to a confluence of 115.60.

    Daily Market Analysis by ForexMart 14718674_199672073792294_1384892384747305024_n
    avatar
    AppleFXMart


    Posts : 1014
    Join date : 2016-10-09

    Daily Market Analysis by ForexMart Empty Re: Daily Market Analysis by ForexMart

    Post  AppleFXMart Wed Oct 12, 2016 3:21 am

    EUR/USD Technical Analysis: October 12, 2016
    The EUR/USD pair was able to extend the sell-off during the Asian trading session and is now targeting the monthly pivot support at 1.1024 points. The decrease in the value of the EUR/USD might be attributed to the sudden controversial drop of the EUR/GBP pair, which shook the whole market in general. The strengthening of the USD has also added pressure on the pair, particularly now that the US dollar is now transacting against risky currencies such as the NZD and AUD.
    On the other hand, the bearish break through of the pair at the 1.11 range again served as a level support for the pair, a function well-used since August. The EUR/USD pair experienced a small recovery after increasing up to 1.1068 before weakening further to 1.1042 points.
    The daily chart for the currency pair shows the trend line going around the 1.1042 range. A break below this particular range could cause a test of the 1.10 range, and might lead to a weakening of up to 1.0911. On the higher side, if the pair goes over its daily high of 1.1068, then this could lead to the pair reaching the 5-DMA of 1.1115 and possibly the 200-DMA of 1.1169.

    Sponsored content


    Daily Market Analysis by ForexMart Empty Re: Daily Market Analysis by ForexMart

    Post  Sponsored content


      Current date/time is Thu Apr 18, 2024 10:12 pm